
MTR(My Traceroute)是一个结合了 traceroute 和 ping 功能的开源网络诊断工具。它通过发送 ICMP 或 UDP 数据包,实时显示数据包经过的路由器及其响应时间,帮助用户分析网络延迟、丢包等问题,是网络工程师和系统管理员的重要工具。
我们来看看mtr有哪些参数
mtr -h

Usage:
 mtr [options] hostname

 -F, --filename FILE        read hostname(s) from a file
 -4                         use IPv4 only
 -6                         use IPv6 only
 -u, --udp                  use UDP instead of ICMP echo
 -T, --tcp                  use TCP instead of ICMP echo
 -I, --interface NAME       use named network interface
 -a, --address ADDRESS      bind the outgoing socket to ADDRESS
 -f, --first-ttl NUMBER     set what TTL to start
 -m, --max-ttl NUMBER       maximum number of hops
 -U, --max-unknown NUMBER   maximum unknown host
 -P, --port PORT            target port number for TCP, SCTP, or UDP
 -L, --localport LOCALPORT  source port number for UDP
 -s, --psize PACKETSIZE     set the packet size used for probing
 -B, --bitpattern NUMBER    set bit pattern to use in payload
 -i, --interval SECONDS     ICMP echo request interval
 -G, --gracetime SECONDS    number of seconds to wait for responses
 -Q, --tos NUMBER           type of service field in IP header
 -e, --mpls                 display information from ICMP extensions
 -Z, --timeout SECONDS      seconds to keep probe sockets open
 -M, --mark MARK            mark each sent packet
 -r, --report               output using report mode
 -w, --report-wide          output wide report
 -c, --report-cycles COUNT  set the number of pings sent
 -j, --json                 output json
 -x, --xml                  output xml
 -C, --csv                  output comma separated values
 -l, --raw                  output raw format
 -p, --split                split output
 -t, --curses               use curses terminal interface
     --displaymode MODE     select initial display mode
 -n, --no-dns               do not resolve host names
 -b, --show-ips             show IP numbers and host names
 -o, --order FIELDS         select output fields
 -y, --ipinfo NUMBER        select IP information in output
 -z, --aslookup             display AS number
 -h, --help                 display this help and exit
 -v, --version              output version information and exit

See the 'man 8 mtr' for details.
使用起来其实也用的参数不多,我们来简单做下测试,然后解读下返回的字段释义
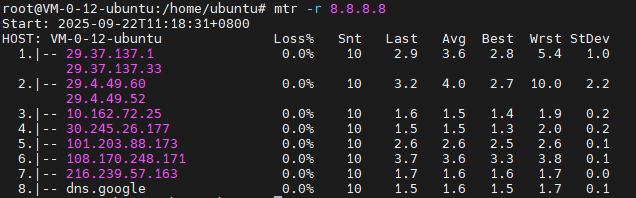
Loss%:丢包率。
Snt:已发送的数据包。
Last:最近一次数据包的延时,mtr所显示的延时相关的时间单位均是毫秒。
Avg:平均延时。
Best:最小延时。
Wrst:最大延时。
Stdev:标准差(Standard Deviation),延时的标准差,这个值越小则延时越稳定。
最左侧的就是路由也就是哪一跳,我们可以明确看到哪一条丢包或者延迟比较大。
一般来说,一旦我们看mtr输出中的某个节点的丢包突然很高,那么我们可能会认为那个节点出问题了。不过,对于大多数路由节点,它们会降低响应ICMP echo request数据包,甚至不相应。因为此类数据包一般用于网络探测,而不作为真实的网络流量数据存在。因此单纯的丢包不能代表真实的丢包情况,可能mtr命令发送的ICMP数据包被100%丢弃,但是真实流量的数据包就不丢弃了。如果我们想判断到底是ICMP流量限制还是真实丢包情况的话,可以看丢包节点的后续节点是否出现丢包。如果像下面这样后续节点都不丢包的话,那么可以理解为该丢包应该是由于ICMP流量限制。
内容版权声明:除非注明,否则皆为本站原创文章。
转载注明出处:https://sulao.cn/post/1133
评论列表