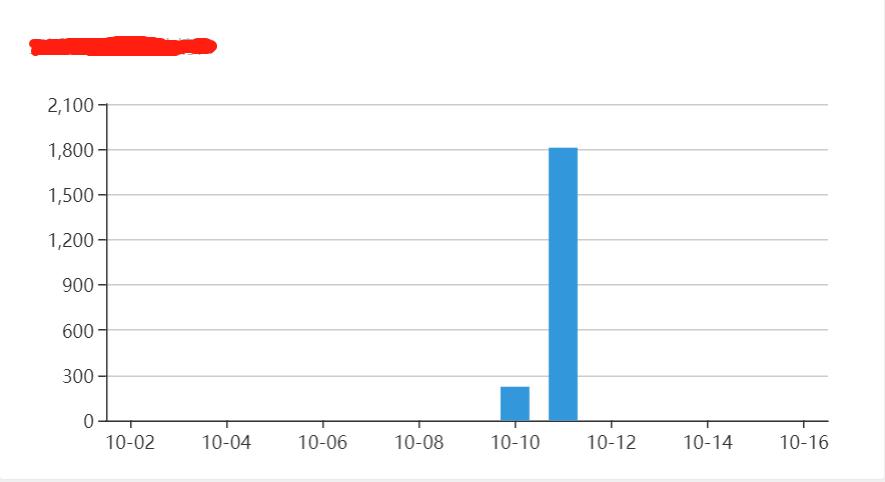
以前用PHP的时候用过,现在用python开发也用了下,记录下用法,下次可以直接复制来用
下载地址:http://echarts.baidu.com/download.html
一般选择常用版本,或者完整版都可以
我用的flask框架开发的运维WEB工具,直接上代码了
函数代码
@panel.route('/newscount', methods=['POST','GET'])
def newsCount():
    #今日开始时间
    today = time.strftime('%Y%m%d')
    today = time.strptime(today, "%Y%m%d")
    today = int(time.mktime(today))

    client = MongoClient(host=getServerIp(), port=getMongoPort())
    db = client[getMongoDbName()]
    coll = db['man']
    i = 0
    #时间戳列表
    timelist = []
    while i < 15:
        timelist.append(today)
        today = today - 86400
        i = i + 1

    #反转时间戳列表
    timelist = list(reversed(timelist))
    #时间列表
    timestrlist = []
    #每日数据总计列表
    newscount = []
    for i in timelist:
        timearray = time.localtime(int(i))
        #时间戳转字串
        result = time.strftime("%m-%d", timearray)
        #今天结束时间
        max_time = i + 86400
        #今天添加统计
        result1 = coll.find({ "timestamp":{"$gte":i, "$lt":max_time} }).count()
        #时间列表压入列表
        timestrlist.append(result)
       	#每日数据统计压入列表
        newscount.append(result1)

    #echarts柱形图配置
    option = {
        'title': {
            'subtext': '最近%d天更新情况' % len(timestrlist)
        },
        'color': ['#3398DB'],
        'tooltip' : {
            'trigger': 'axis',
            'axisPointer' : {
                'type' : 'shadow'
            }
        },
        'grid': {
            'left': '3%',
            'right': '4%',
            'bottom': '3%',
            'containLabel': 'true'
        },
        'xAxis' : [
            {
                'type' : 'category',
                'data' : timestrlist,
                'axisTick': {
                    'alignWithLabel': 'true'
                }
            }
        ],
        'yAxis' : [
            {
                'type' : 'value'
            }
        ],
        'series' : [
            {
                'name':'添加数据总数',
                'type':'bar',
                'barWidth': '60%',
                'data': newscount
            }
        ]
    }
    return jsonify(option)
前端代码如下
{% include 'public/header.html' %}
<div class="layui-warp">
    <div class="layui-curve">
        <div class="layui-card">
            <div class="layui-card-header">所有文章报表</div>
            <div class="layui-card-body">
                <div id="news" style="width: 100%; height:250px;"></div>
            </div>
        </div>
    </div>
</div>
<script src="{{ url_for('static',filename='js/echarts.common.min.js') }}"></script>
<script>
layui.use(['layer', 'jquery'],function(){
    var layer = layui.layer
    ,$ = layui.jquery;
    $.ajax({
        url: '{{ url_for("panel.newsCount") }}',
        type: 'POST',
        dataType: 'json',
        success: function(json){
            //console.log(json);
            var myChart = echarts.init(document.getElementById('news'));
            myChart.setOption(json);
        }
    });
});
</script>
{% include 'public/footer.html' %}
下面是效果图

